
How can infographics be used for teaching?
Infographics are a popular way of getting information across to the public. Many people use them for blogging and marketing purposes, but they can also be used as teaching tools in the classroom. They help students who have a visual learning style retain more of what they have been taught.
Through this article, we will talk about why infographics work so well for teaching purposes and how educators can implement them successfully in their classrooms. Infographics are visual representations of data that are often designed to teach readers about a specific topic or idea. The reader or listener will absorb information much faster when it is delivered through an infographic because it uses visuals to show examples and simplify complex concepts. This makes infographics a valuable tool for teachers who struggle with engaging students because they all have different learning styles and different IQ and memorizing capacities.
Teaching with infographics to engage students and promote learning
Infographics are an excellent visual way to communicate complex ideas in a simple way. They can be used for educational purposes and also to promote learning. It seems like infographics are one of the mandatory instruments in the classroom today, so let's explore how they can be used in teaching and education.
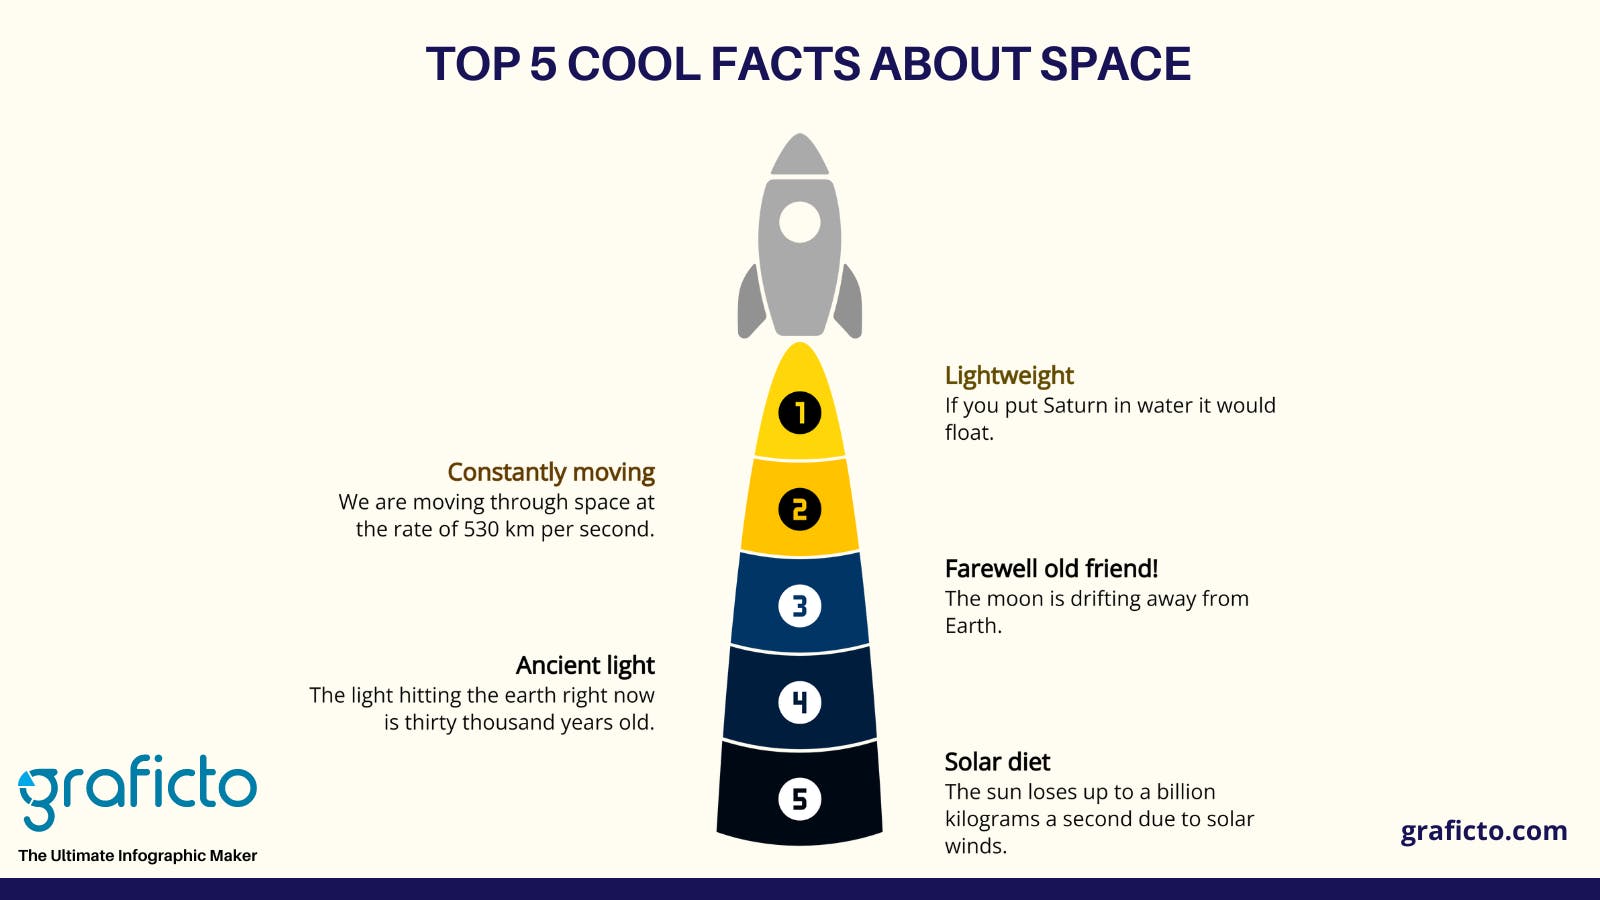
An infographic is a graphic representation of information, using various charts, including rectangle or square grids and picture designs, to present complex information quickly and clearly. They are usually easy to understand because they use shapes, colors, icons, labels, and text to represent data more efficiently than words or numbers alone. Infographics can be presented as maps, diagrams, illustrations, or drawings. They can make it easier for students to grasp things visually rather than having them read through pages of text, which could cause them some confusion.
Infographic for PowerPoint presentations and virtual learning
Infographics are a powerful way to communicate a message in a quick and easy manner. They can be used effectively in teaching strategies for professors and teachers.
Using infographics in PowerPoint presentations is a highly effective strategy due to the fact that it allows presenters to take complicated concepts and break them down into simpler, more digestible pieces. It provides the audience with information that they may not have understood otherwise.
Moreover, at a time when the whole world had to shift not only teaching but also most office tasks, shops, and customer services to virtual mode, infographics have become the most popular types of content today. Especially with regards to virtual learning, infographics provide readers with information accurately though they are not physically in the classroom, and on the other hand, they make teachers’ tasks a lot easier on all the online platforms. Ultimately you are not just filling the digital learning gap for students, but you’ll be keeping your audience entertained.
Make an infographic with your students instead of creating it for them
Teachers have been creating infographics for their classrooms for generations. But today, teachers aren’t limited to creating and using infographics to teach students, but also teachers can make students involved in creating infographics on their own encouraging active learning.
Sometimes, students may have better and more creative ideas for comprising information into an infographic which is easier for them and their colleagues to understand and memorize.
How to get started with an infographic as a teaching tool in the class
If you’re wondering how you can start using infographics in your classroom or to make students create infographics themselves, well, the task is not that difficult. An online application like Graficto is all that you need. You only follow the link below and try to start excelling in your creativity with infographics. Graficto can be recognized as one of the best and most user-friendly application, which has hundreds of pre-designed templates in various categories. Graficto users just have to select a template design and customize that, feeding the information that they require and also changing the font styles, colors and icons as per their choice. Graficto facilitates sharing the infographics with social media or even downloading them as an image easily. More surprisingly, it is a totally free platform that thousands of users are utilizing daily worldwide. Try Graficto today
Furthermore, you can even request the Graficto team to create infographic template designs for you. All you have to do is suggest your idea in the suggestions portal.
If you wish to know how to create an infographic with Graficto, click on the video link below and learn more.