Introduction
Welcome to the world of Six Sigma, a transformative methodology that has revolutionized business processes across industries. As an expert in the field, I am here to guide you through the remarkable benefits and immense potential that Six Sigma offers when coupled with the cutting-edge power of infographic-making tools. In this article, we will explore how this powerful combination can elevate your organization's performance and drive you toward unprecedented levels of success.
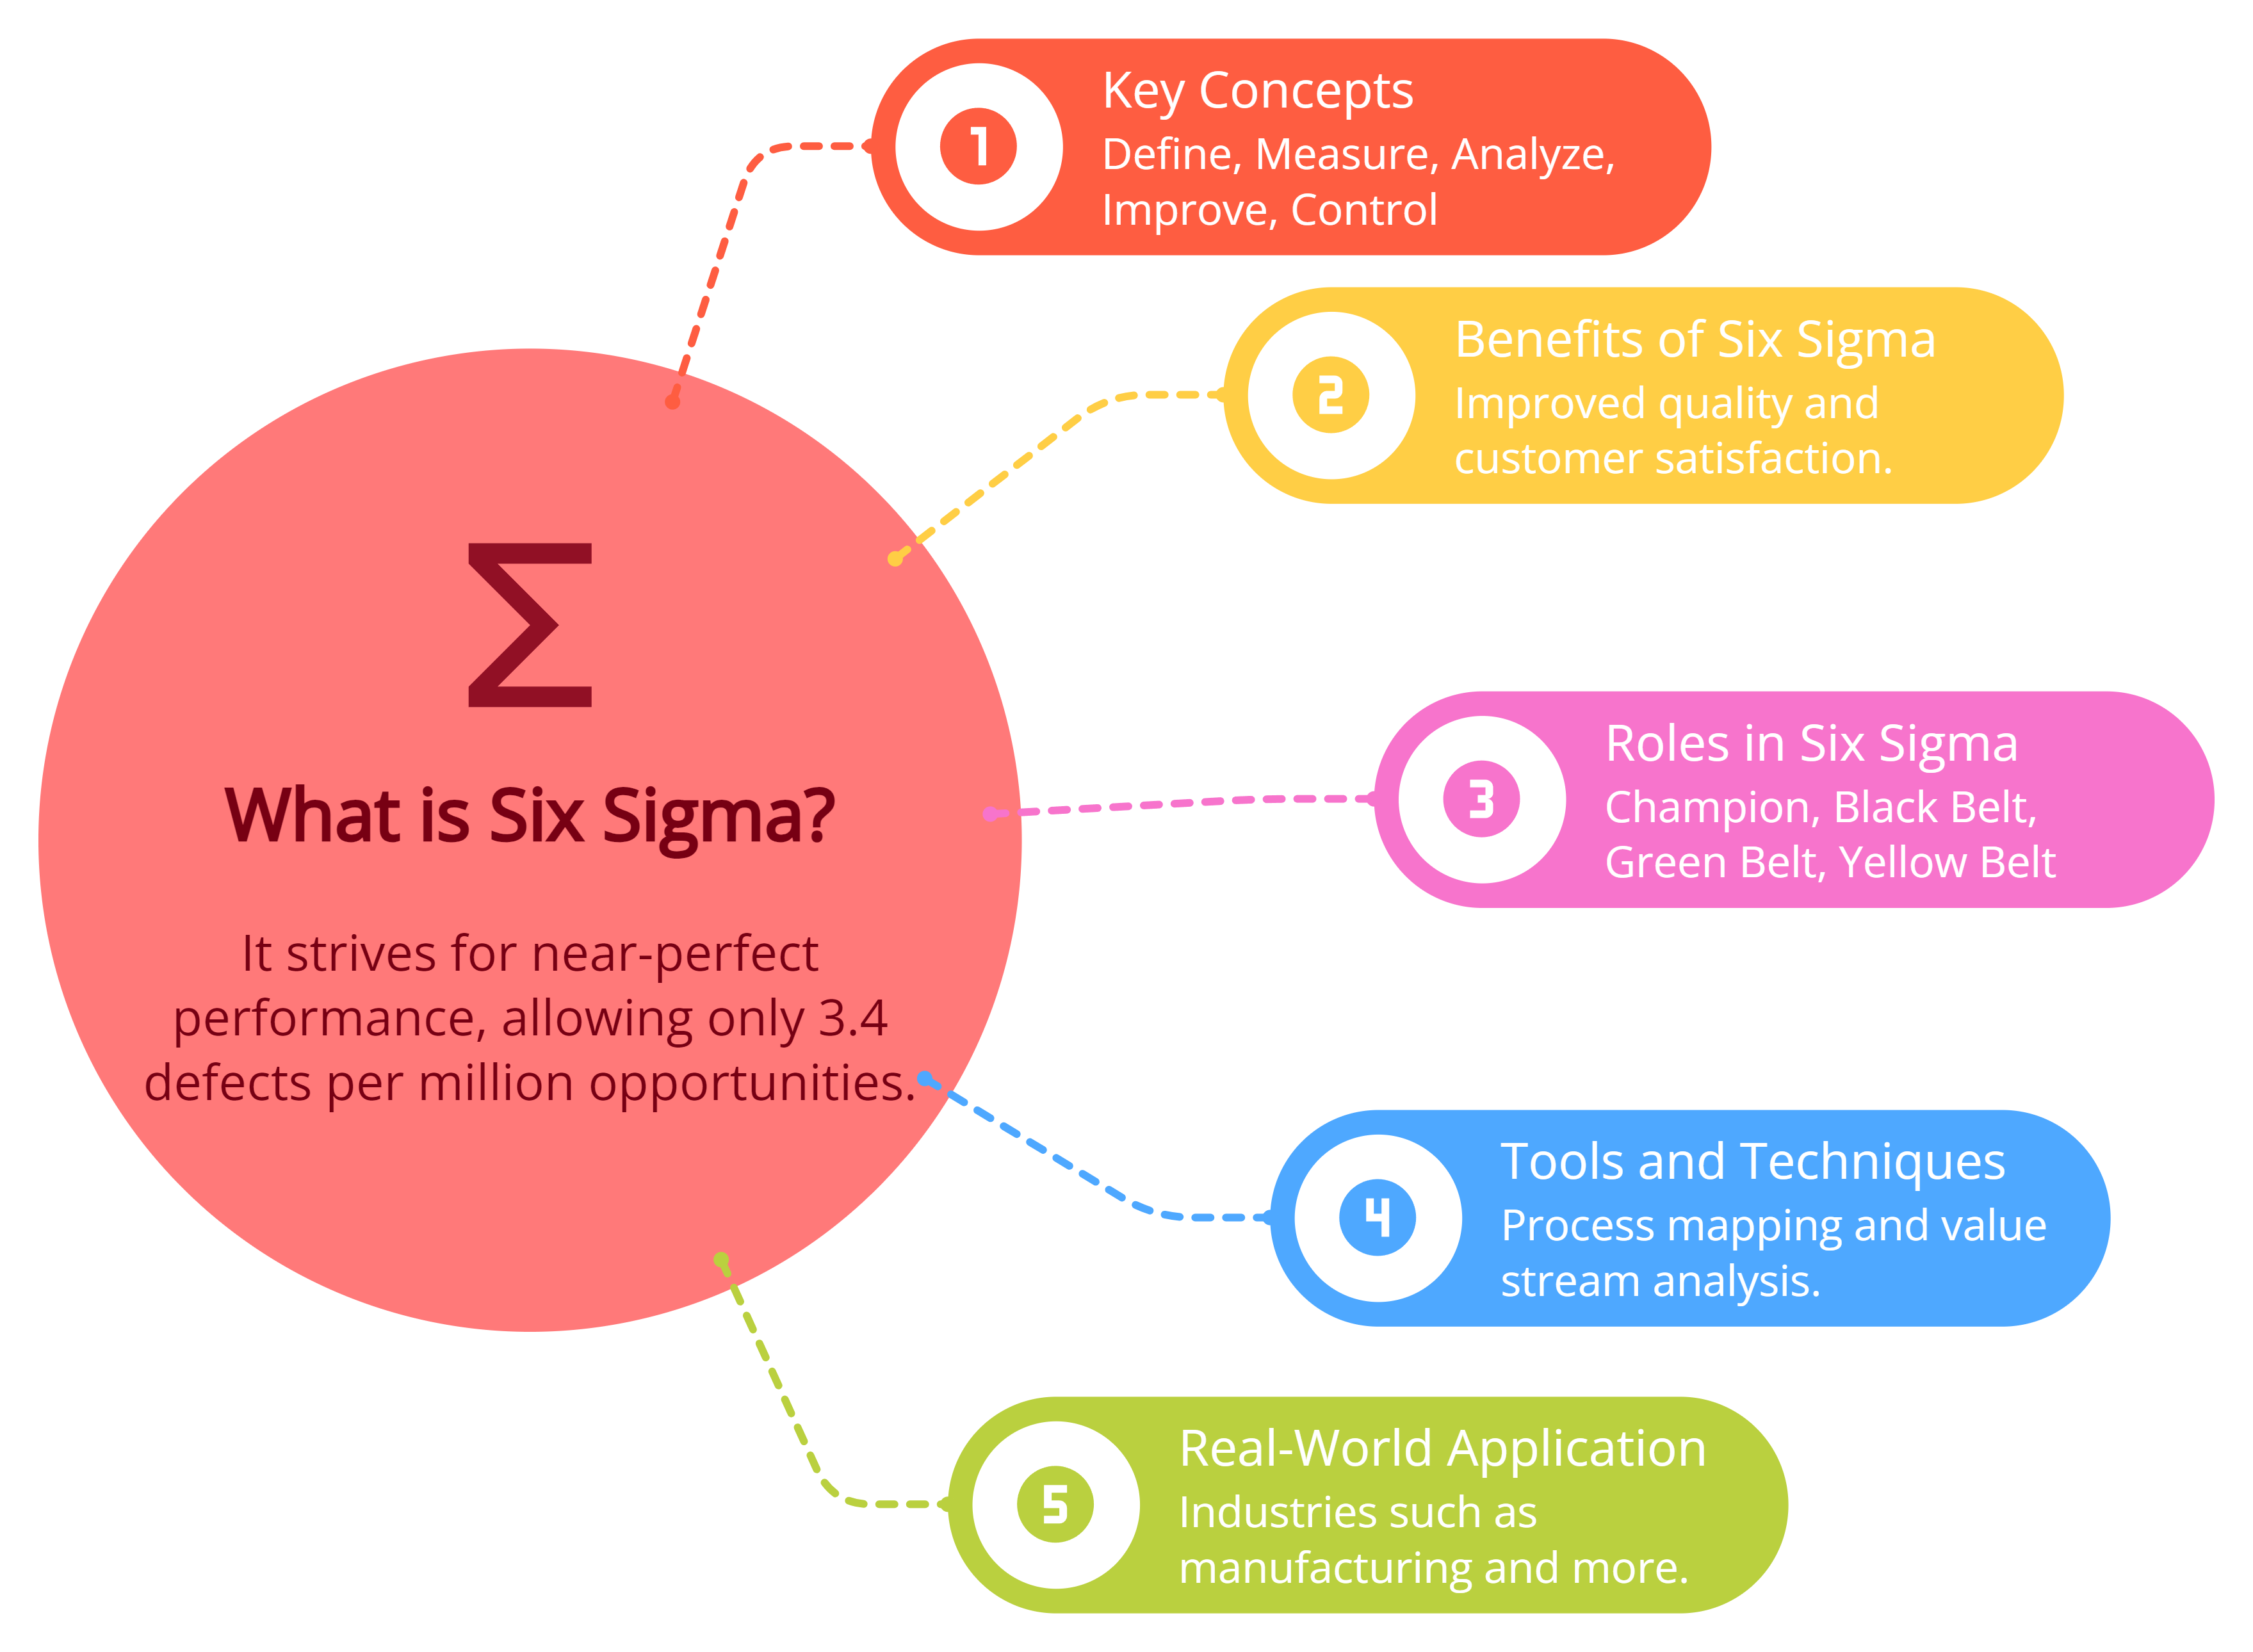
Understanding Six Sigma
At its core, Six Sigma is a methodology that aims to improve business processes by reducing defects, minimizing variation, and optimizing efficiency. It is a data-driven approach that enables organizations to make informed decisions based on statistical analysis and empirical evidence.
By leveraging Six Sigma, companies can identify areas of improvement, optimize their operations, and enhance customer satisfaction. The goal is to achieve near-perfection in process performance, with a target defect rate of 3.4 defects per million opportunities.
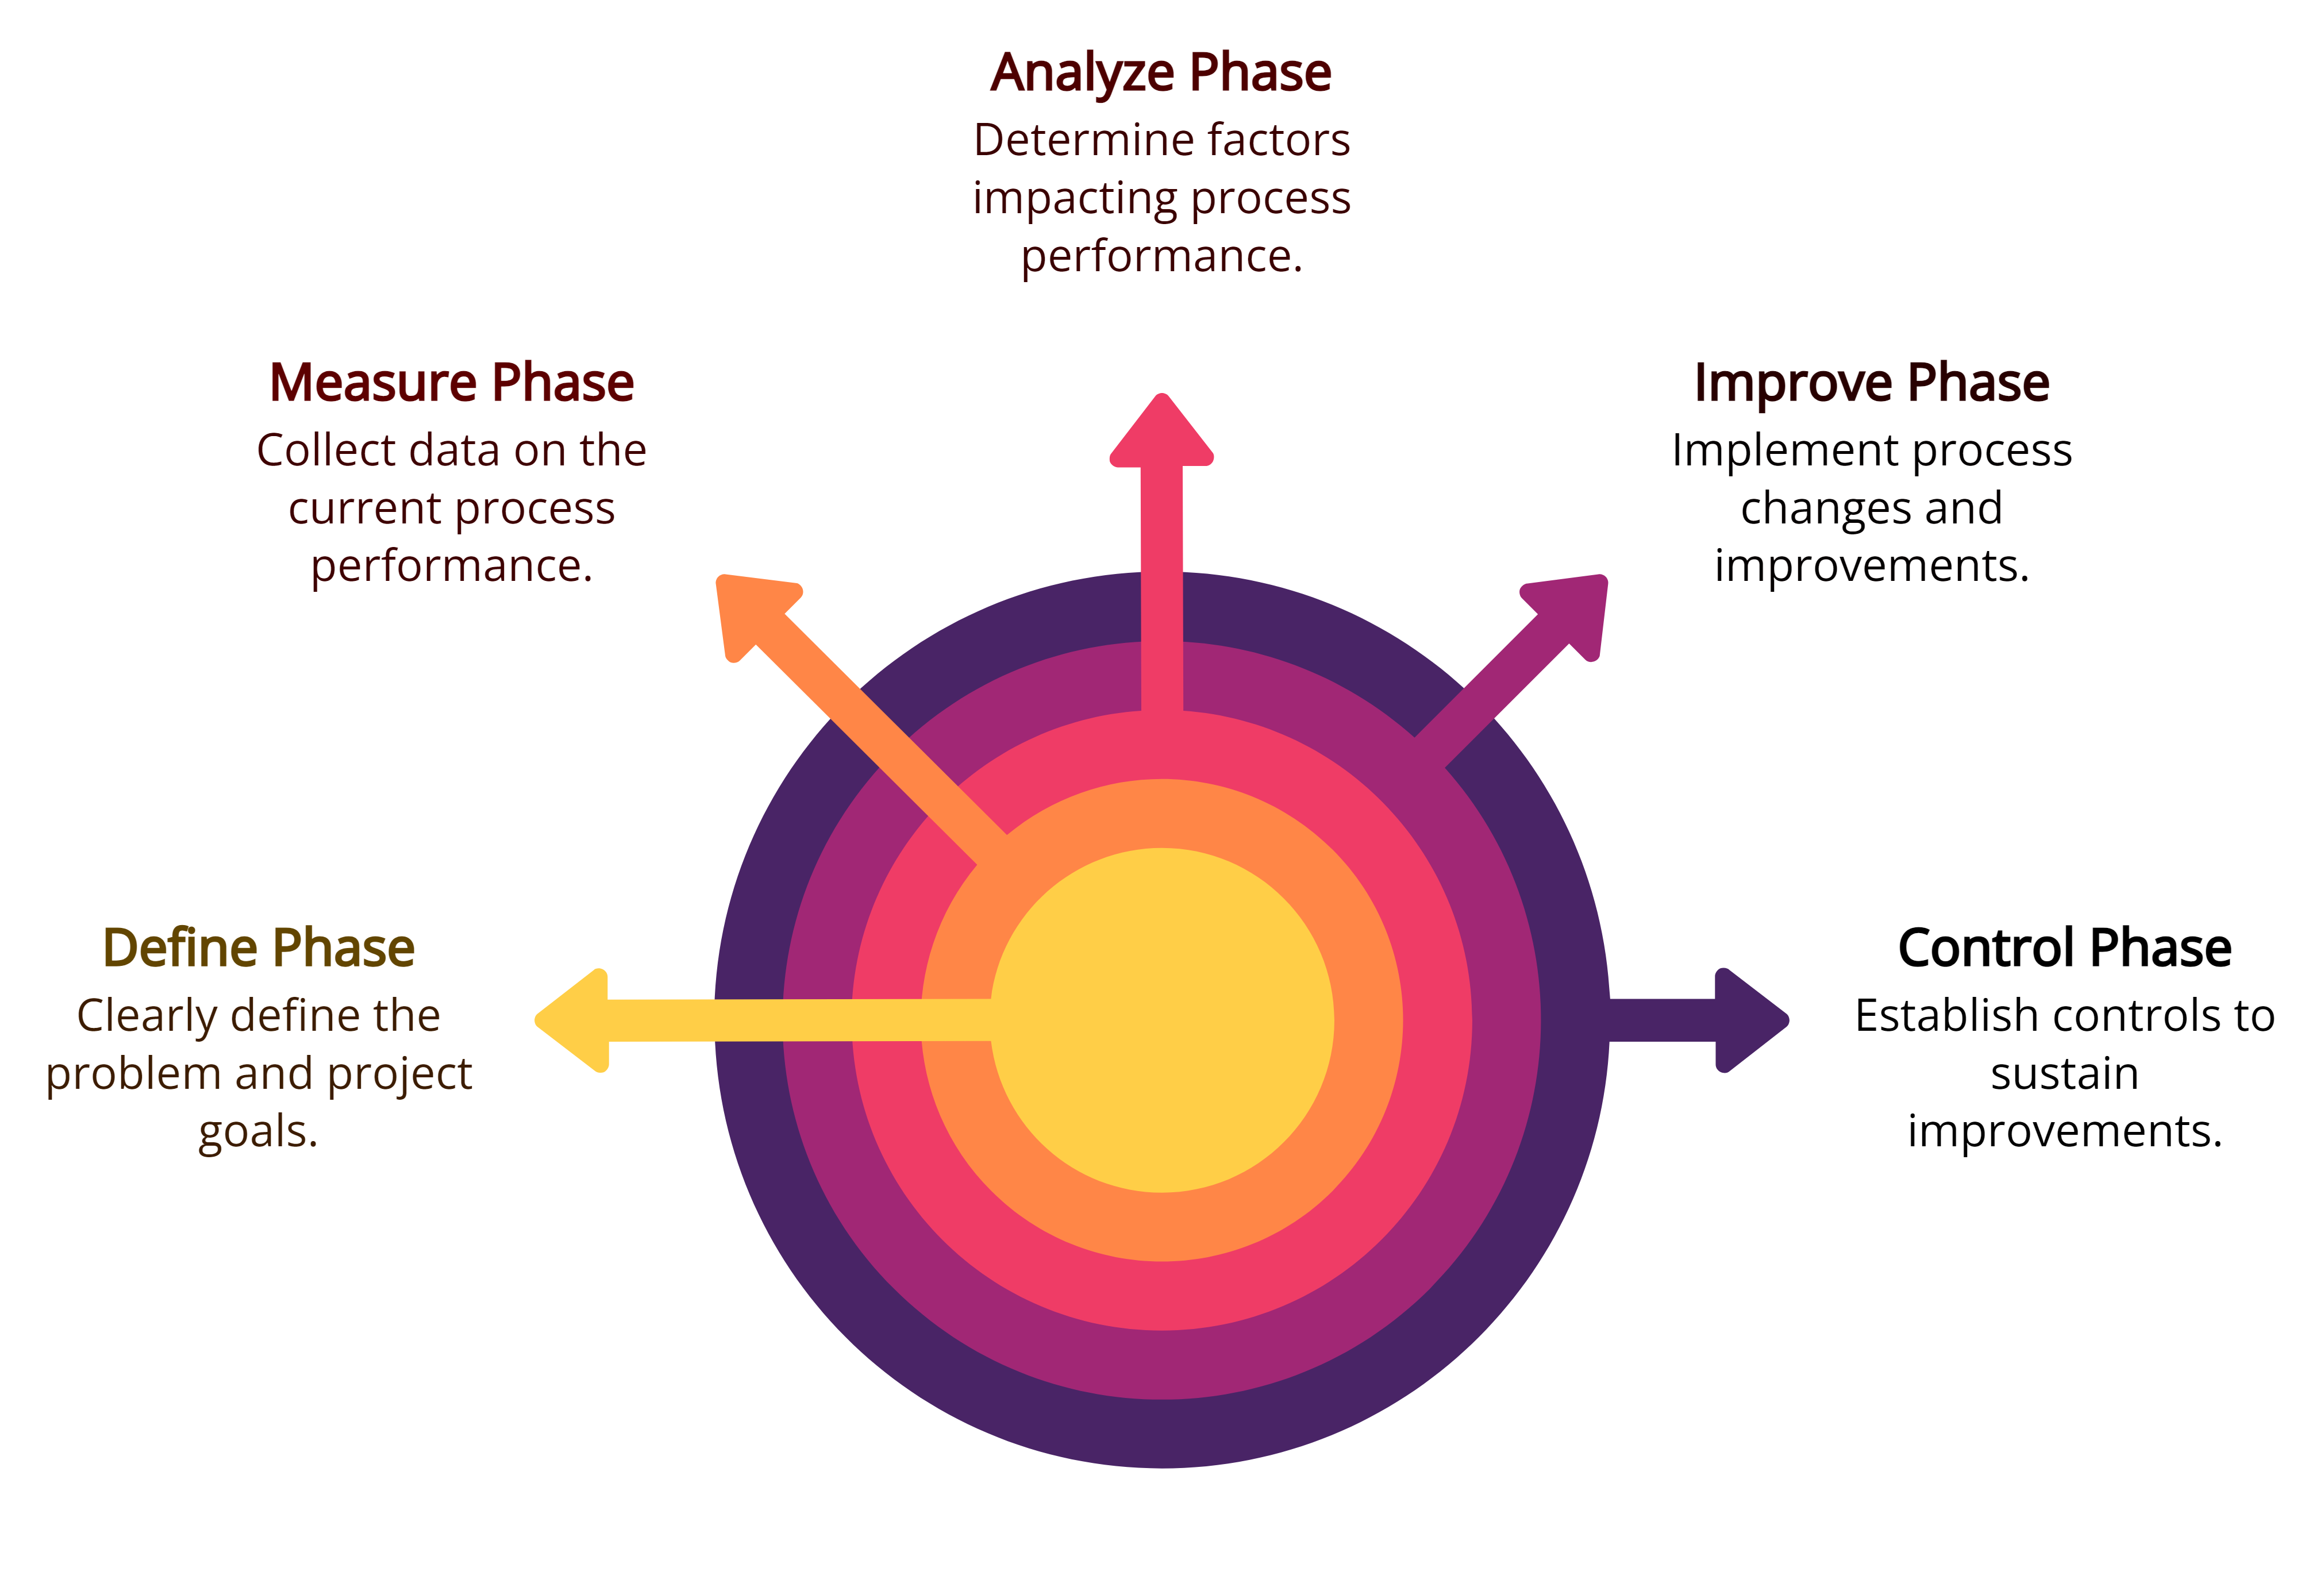
The Five Phases of Six Sigma
The Six Sigma methodology employs a systematic approach known as DMAIC, an acronym representing define, measure, analyze, improve, and control. According to Six Sigma proponents, any seemingly insurmountable challenge a business faces can be effectively addressed by adhering to these five phases:
1. Definition Phase
Guided by a Six Sigma expert, a team of individuals selects a specific process for concentration and precisely outlines the issue they intend to resolve.
2. Measurement Phase
The team gauges the initial performance of the chosen process, establishing a baseline, and identifies a list of inputs that could potentially impede optimal performance.
3. Analysis Phase
Subsequently, the team dissects the process by isolating each input or potential factor contributing to any shortcomings, subjecting each to testing as a plausible root cause of the problem.
4. Improvement Phase
Progressing from there, the team initiates changes designed to enhance the performance of the system.
5. Control Phase
The group introduces controls to the process to ensure that any progress achieved is sustained, preventing any regression that might render the process ineffective once more.
Benefits of Six Sigma
1. Improved Quality
By focusing on reducing defects and variations, Six Sigma leads to higher product and service quality, resulting in increased customer satisfaction.
2. Cost Reduction
A reduction in defects and variations leads to fewer errors, rework, and waste, ultimately lowering operational costs.
3. Data-Driven Decision-Making
Six Sigma relies on data analysis to identify root causes and drive informed decision-making, fostering a culture of evidence-based problem-solving.
4. Enhanced Efficiency
Through process optimization and waste reduction, Six Sigma helps organizations operate more efficiently, saving time and resources.
5. Organizational Culture
Implementing Six Sigma promotes a culture of continuous improvement, collaboration, and accountability across all levels of an organization.
Getting Started with Six Sigma
1. Training
Beginners can enroll in Six Sigma training programs to learn about the methodology, tools, and techniques. These programs often lead to certifications, such as Yellow Belt, Green Belt, and Black Belt, depending on the level of expertise.
2. Selecting Projects
Identify projects with significant potential for improvement. Projects should align with organizational goals and have measurable outcomes.
3. Assemble Teams
Collaborative teams consisting of members with diverse skills and knowledge are crucial for successful Six Sigma projects.
4. Applying DMAIC
Utilize the DMAIC framework to guide project implementation, from defining the problem to ensuring sustained improvements.
Infographic-Making Tools: The Perfect Complement to Six Sigma
To effectively communicate complex data and insights derived from the Six Sigma methodology, infographic-making tools emerge as invaluable assets. These tools allow you to visually represent information, making it more accessible, engaging, and persuasive.
Infographics have become a powerful medium for conveying complex ideas and data in a concise and visually appealing manner. By utilizing an infographic-making tool, you can transform raw data into compelling visuals that capture attention, simplify complex concepts, and foster better understanding among stakeholders.
Enhancing Data Visualization with Infographics
Infographic-making tools provide a wide range of features and templates specifically designed to help you present Six Sigma data in a visually stunning way. Here are some key benefits of integrating infographics into your Six Sigma journey:
Simplify Complex Concepts
Six Sigma often involves intricate statistical analyses and data interpretation. Infographics enable you to distill complex information into easily digestible visual elements, allowing stakeholders to grasp the insights quickly.
Engage Stakeholders
Infographics captivate audiences with their visually appealing design and storytelling capabilities. By presenting Six Sigma findings through infographics, you can effectively engage and inform stakeholders, fostering greater buy-in and support for process improvements.
Highlight Key Metrics
Infographics empower you to showcase key performance indicators (KPIs), process metrics, and improvement targets with clarity and impact. By highlighting the most relevant information in a visually appealing format, you can facilitate informed decision-making and drive action.
Foster Collaboration
Infographics serve as powerful communication tools, facilitating collaboration and alignment across teams. By visually presenting data and insights, you can promote a shared understanding of the Six Sigma process, encouraging cross-functional teams to work together towards continuous improvement.
Enhance Knowledge Retention
Research has shown that visuals are processed and remembered more effectively than text alone. Using infographics can enhance knowledge retention and reinforce key messages related to Six Sigma initiatives.
Conclusion
As an expert in Six Sigma methodologies, I cannot emphasize enough the impact that integrating an infographic-making tool can have on your organization's success. By combining the power of Six Sigma's data-driven decision-making with the captivating visuals offered by infographic-making tools, you can enhance understanding, engage stakeholders, and drive meaningful change.
Unlock the potential of your Six Sigma journey by harnessing the persuasive power of infographics. Utilize the vast array of features and templates offered by infographic-making tools to simplify complexity, engage stakeholders, highlight key metrics, foster collaboration, and enhance knowledge retention.
Embrace this winning combination, and elevate your organization's performance to new heights. Let data-driven decision-making and visually compelling infographics become the cornerstone of your journey toward excellence.
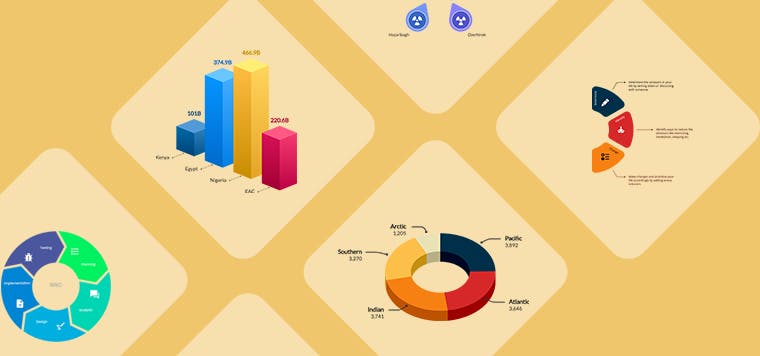
Graficto offers a wide variety of templates to suit Six Sigma visualization works, whether your purpose is to explain a process, present a list of data, or compare different elements. For example, you can use a flow chart-type template to break down a complex process or a comparison-type template to highlight the similarities and differences between two or more items. With Graficto, the possibilities are endless. In the following, we added some sample infographic templates for your reference.