1. The Infographic History of the World by Valentina D'Efilippo and James Ball
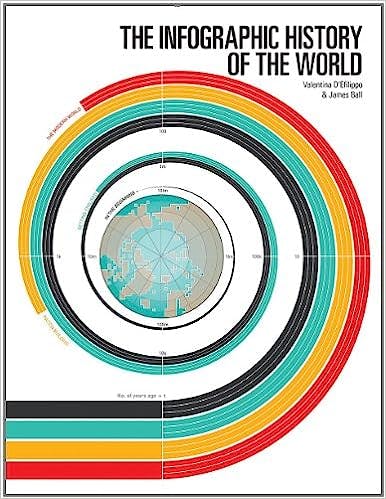
Image source: amazon
This book takes readers on a fascinating journey spanning 13.8 billion years, starting from the beginning of time. The book is divided into four sections
● In the Beginning
● Getting Civilized
● Nation Building
● The Modern World
each presenting world history through a visually stunning collection of infographics featuring facts, timelines, and trends. The book's design perfectly reflects its content, starting with simple parchment-like paper stock and typography and gradually moving towards glossy pages, minimalist design, and brilliant color.
With 74 topics, 100 infographics, and 224 pages, the book covers a wide range of historical events, including the rise and fall of civilizations, wars, and peace treaties, scientific discoveries and inventions, and contemporary issues such as food consumption, pollution, drug use, and gun violence. It also delves into existential questions such as the universe's origin, humanity's future, and the cause of death and change.
This captivating book is an entertaining and informative reference for readers of all ages and interests. Its stunning visuals will inspire and enlighten them. The Infographic History of the World is a must-have coffee table book that offers a unique and engaging perspective on the history of the world and the evolution of human civilization.
2. The Functional Art: An Introduction to Information Graphics and Visualization by Alberto Cairo
Image source: amazon
This book provides a hands-on guide for comprehending and utilizing information graphics. It will equip you with the skills to leverage data visualizations as instruments to gain a deeper understanding of the intricate world we inhabit, moving beyond mere lists of figures and variables. No matter the type of data you are dealing with, be it related to business, science, politics, sports, or your finances, this guide will instruct you on utilizing statistical charts, maps, and explanatory diagrams to uncover narratives within the data that acquired fresh insights.
3. Cool Infographics: Effective Communication with Data Visualization and Design by Randy Krum
Image source: amazon
This book is an essential resource for graphic designers, marketers, and business professionals as it provides valuable insights into the most effective ways to present data. It delves into why infographics and data visualizations are so impactful and offers guidance on the tools and techniques required to create impressive infographics. The book also covers online infographics for marketing, including social media and search engine optimization (SEO), and how to market your skills using an infographic resume. Additionally, it explores various internal business applications of infographics, such as presenting at board meetings, showcasing annual reports, displaying consumer research statistics, devising marketing strategies, developing business plans, and providing visual explanations of products and services to customers. With Cool Infographics as your guide, you will acquire the skills to craft compelling infographics that effectively communicate with your intended audience and convey your data-driven stories.
4. The Best American Infographics 2016 edited by Gareth Cook
Image source: amazon
This book is a collection of the best infographics from the year, showcasing the diversity and creativity of the field.
5. Data Visualization: A Practical Introduction by Kieran Healy
Image source: amazon
This book offers a practical guide for students and researchers to understand the principles and application of data visualization. It covers essential topics such as the factors that make graphs effective, techniques for producing high-quality visualizations from data using reliable methods, and a practical approach to thinking about data visualization with honesty and effectiveness.
6. Information is Beautiful by David McCandless
Image source: amazon
This book is a stunning collection of infographics that explore a wide range of topics, from science and technology to politics and culture.
7. Better Data Visualizations: A Guide for Scholars, Researchers, and Wonks by Jonathan Schwabish
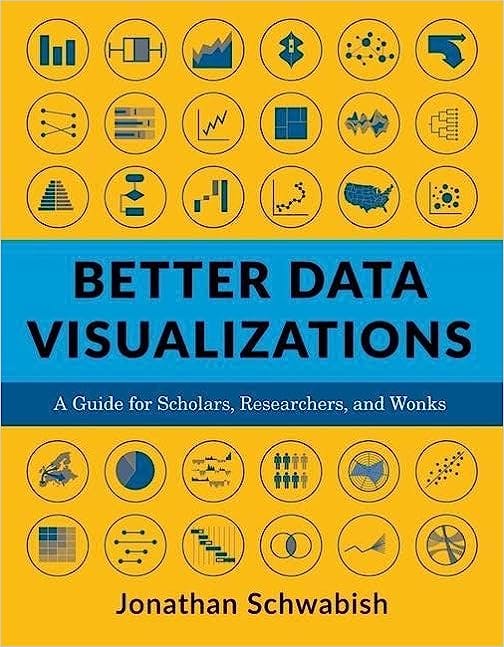
Image source: amazon
In this book, Jonathan Schwabish provides crucial tactics for producing more impactful data visualizations. He expertly guides readers through crafting superior graphs and moving beyond the primary line, bar, and pie charts. With over five hundred examples, Schwabish illustrates the dos and don'ts of data visualization, elucidates the principles of visual perception, and demonstrates how to make subjective style decisions when designing a chart. The author surveys over eighty visualization types, including histograms, horizon charts, ridgeline plots, and choropleth maps, and explains when each type is appropriate. Despite the potential intimidation factor, this book assures readers that anyone can learn how to create compelling data visualizations. It serves as a guide in defining your audience and objectives, selecting the appropriate graph for your data, and effectively conveying your message.
8. Visualize This: The Flowing Data Guide to Design, Visualization, and Statistics by Nathan Yau
Image source: amazon
This book teaches readers how to create compelling infographics using a combination of data, design, and storytelling.
9. Data Points: Visualization That Means Something by Nathan Yau
Image source: amazon
This book showcases a wide range of infographics that tell compelling stories about the world around us and provides insights into how they were created.
10. The Big Book of Dashboards: Visualizing Your Data Using Real-World Business Scenarios by Steve Wexler, Jeffrey Shaffer, and Andy Cotgreave
Image source: amazon
This book teaches readers how to design effective dashboards that can help businesses make better decisions based on their data.
We recommend you all read these books with the assurance that they will be broadly supportive for those focusing on visual learning. Moreover, suppose you are an author with a similar context or intending to present something visually attractive via infographics. In that case, you can easily create customized infographics using Graficto. You don’t need design skills to utilize this app, as it is remarkably user-friendly.
